







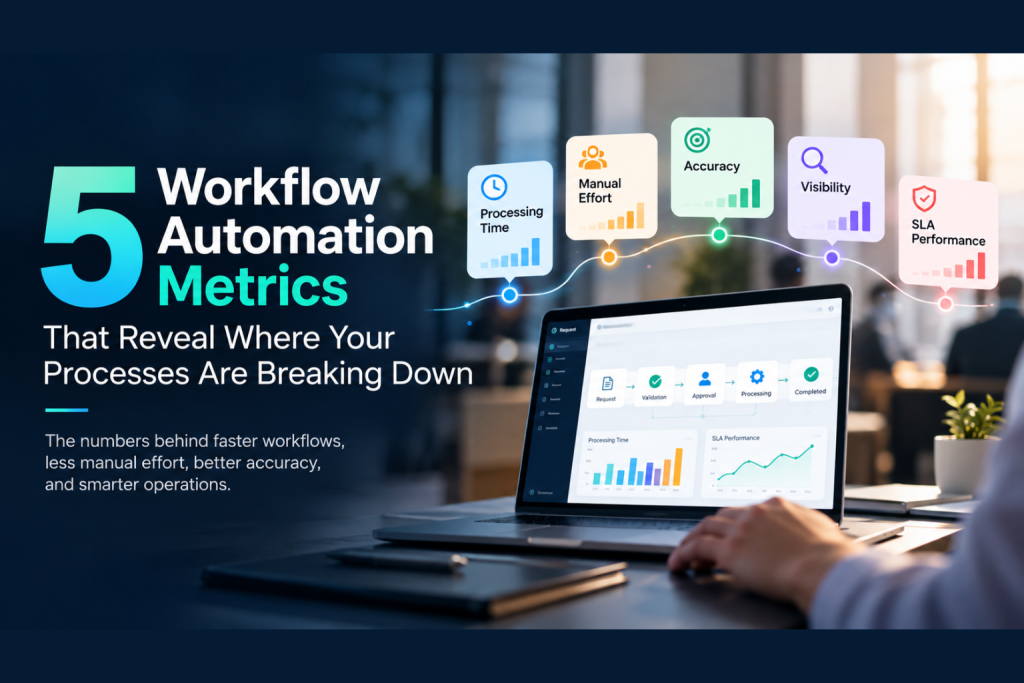
5 Workflow Automation Metrics That Reveal Where Your Processes Are Breaking Down
The numbers behind faster workflows, less manual effort, better accuracy, and smarter operations
When a Process Works—Until It Doesn't
Imagine a procurement team handling hundreds of requests every day.
A request arrives by email. Someone checks the details. Another person validates the information. The request is entered into a system. Approval is followed up. Someone checks the status again. Another email is sent.
Nothing is technically broken.
The process works.
But when the volume increases, those small manual steps begin to add up.
Minutes become hours. Follow-ups multiply. Errors creep in. Teams spend more time tracking work than moving it forward.
This is how workflow problems often begin, not with a broken process, but with a process that can no longer scale efficiently.
The challenge is knowing where the friction is.
That’s where the right metrics can help.
1. Processing Time: How Long Does Work Really Take?
Start with a simple question:
How long does it take to complete one transaction from beginning to end?
Don’t just measure the time someone spends actively working. Look at the entire workflow—including waiting, validation, approvals, handoffs, and follow-ups.
A Qruize procurement automation engagement provides a clear example. By automating the PR/PO lifecycle, processing time was reduced from 30 minutes to 13 minutes per transaction—a 57% reduction.
That difference becomes significant when the process runs hundreds or thousands of times.
"If processing time keeps increasing as volume grows,
your workflow may be telling you it's time to automate."
2. Manual Effort: How Much Time Are People Spending Repetition?
Now look at the people behind the process.
How much time are employees spending on:
- Copying information
- Validating data
- Updating systems
- Checking statuses
- Sending notifications
- Following up on approvals?
These activities may be necessary, but they don’t always require human judgment.
In another Qruize procurement automation engagement, task completion time dropped from 10 minutes to 2 minutes per request, with approximately 2,500 annual hours saved.
That’s more than a productivity statistic.
It’s an indication of how much capacity can be released when repetitive work is redesigned.
The more time people spend managing a workflow, the more closely you should examine what can be automated.
3. Accuracy: Is Faster Also Better?
Here’s where speed alone can be misleading.
Imagine processing 1,000 requests twice as fast—but having to manually correct hundreds of them afterward.
You’ve gained speed but created another problem.
That’s why automation should also be measured by accuracy and rework.
In the same Qruize procurement automation engagement, the solution achieved 99% automation accuracy.
The goal isn’t simply to make work move faster.
It’s to make work move faster with greater consistency.
4. Visibility: Do You Know Where the Work Is?
Here’s a question many teams don’t ask until something goes wrong:
“Where is this request right now?”
If the answer requires checking an email thread, opening a spreadsheet, messaging another team, or logging into multiple systems, there’s a visibility problem.
This becomes particularly difficult when workflows cross departments.
In a Qruize order workflow engagement, the existing process involved manual tracking, disconnected systems, email dependency, and limited visibility into order progress.
The solution introduced real-time tracking, centralized dashboards, SLA monitoring, automated alerts, and CRM integration.
When people spend time searching for workflow status, the workflow itself needs attention.
5. SLA Performance: Where Are Delays Happening?
Finally, ask:
Is the workflow meeting the time it was designed to meet?
A process might technically complete—but if approvals consistently take too long or requests repeatedly miss their SLA, something is wrong.
Track:
- SLA compliance
- Average delay
- Number of breaches
- Waiting time between stages
- Escalations
Automated SLA tracking and escalation can make these delays visible before they become larger operational problems. Qruize’s order workflow solution incorporated SLA-based tracking, alerts, and escalations as part of the automated process.
A missed SLA isn’t just a delay. It’s a signal that something in the workflow needs to be examined.
The Bigger Picture
These metrics become much more powerful when viewed together.
If processing time is high and manual effort is high, look for repetitive tasks.
If accuracy is low, look for manual data entry and validation.
If visibility is poor, look for disconnected systems and communication gaps.
If SLA breaches are frequent, look for bottlenecks and unnecessary handoffs.
The point isn’t to collect more numbers.
The point is to use those numbers to find where the workflow is holding the business back.
From Measurement to Automation
The best automation decisions don’t begin with:
“What can we automate?”
They begin with:
“Where is our process losing time, effort, accuracy, or visibility?”
Measure the workflow.
Find the friction.
Automate where it matters.
Then measure again.
That’s how automation becomes an ongoing improvement cycle rather than a one-time technology project.
And once workflows become more connected, measurable, and visible, organizations can take the next step from workflow automation to workflow intelligence.
Conclusion
A workflow doesn’t have to be completely broken to need improvement.
Sometimes the warning signs are much smaller:
30 minutes becoming 13.
10 minutes becoming 2.
Thousands of hours spent on repetitive work.
Teams searching for status updates.
SLAs missed again and again.
These are not just operational numbers.
They are signals.
The organizations that pay attention to those signals can identify where automation will have the greatest impact—and build workflows that are not only faster, but more accurate, visible, and scalable.
Ready to identify where your workflows can perform better?
Talk to Qruize about building smarter, scalable workflow automation.